mateus

CharterUp

Shuttle trip monitoring

Context and background

CharterUp is the biggest player in the chartering transport industry in the US and Canada. This case covers the shuttle trip monitoring feature, piloted during the San Francisco shuttle expansion and later rolled out to bus monitoring across the platform. From fragmented spreadsheets and manual check-ins to a real-time monitoring tool that the ops team and end customers could actually rely on.

role and scope

user research, user testing, prototyping, documentation, UI design

stakeholders

2 product managers, 7 engineers, CEO validation

timeline

~7 months from start to finish

tools

Figma

Book a bus at CharterUp

What got us here in the first place?

How do you rate our trip monitoring?

2/5

What our support team wants

actual ETAs
reduced spreadsheet workload
incident reporting
birds-eye view

What causes the most friction during trips for our customers?

74%
no real-time updates
61%
inaccurate ETAs
48%
no driver contact
22%
unclear pickup spots

“There's no way to tell which MLK Avenue we're talking about. Half the country has one.”

support team member

growth opportunity

Golden opportunity in the expanding shuttle market around the San Francisco Bay Area

The problem

Monitoring was fragmented and unreliable for both the operations team and the end customer. Dispatchers had no real-time visibility into trip status, and passengers were left completely in the dark about where their shuttle was, leading to frustration, missed connections, and a flood of inbound support calls that the team had no scalable way to handle.

The challenge

Our monitoring system was a mess. Neither customers nor office workers wanted to use it, and honestly, it's hard to blame them. The whole process was deeply manual, relying heavily on calling people and waiting for someone to pick up and have an answer. That wait was so time-consuming that it wasn't unusual to go hours without a single update on an active trip. How can we improve our monitoring system to actually accommodate for the needs of the business?

The opportunity

Shuttle monitoring presented the ideal starting point: a contained, geographically localized scenario operating within the San Francisco Bay Area. With the return-to-office movement gaining strong traction in 2025, corporate shuttle routes were expanding fast, and a well-designed monitoring tool built for this context could scale directly into the broader bus network with massive growth potential already in motion.

Desk research and references

How does it work today?

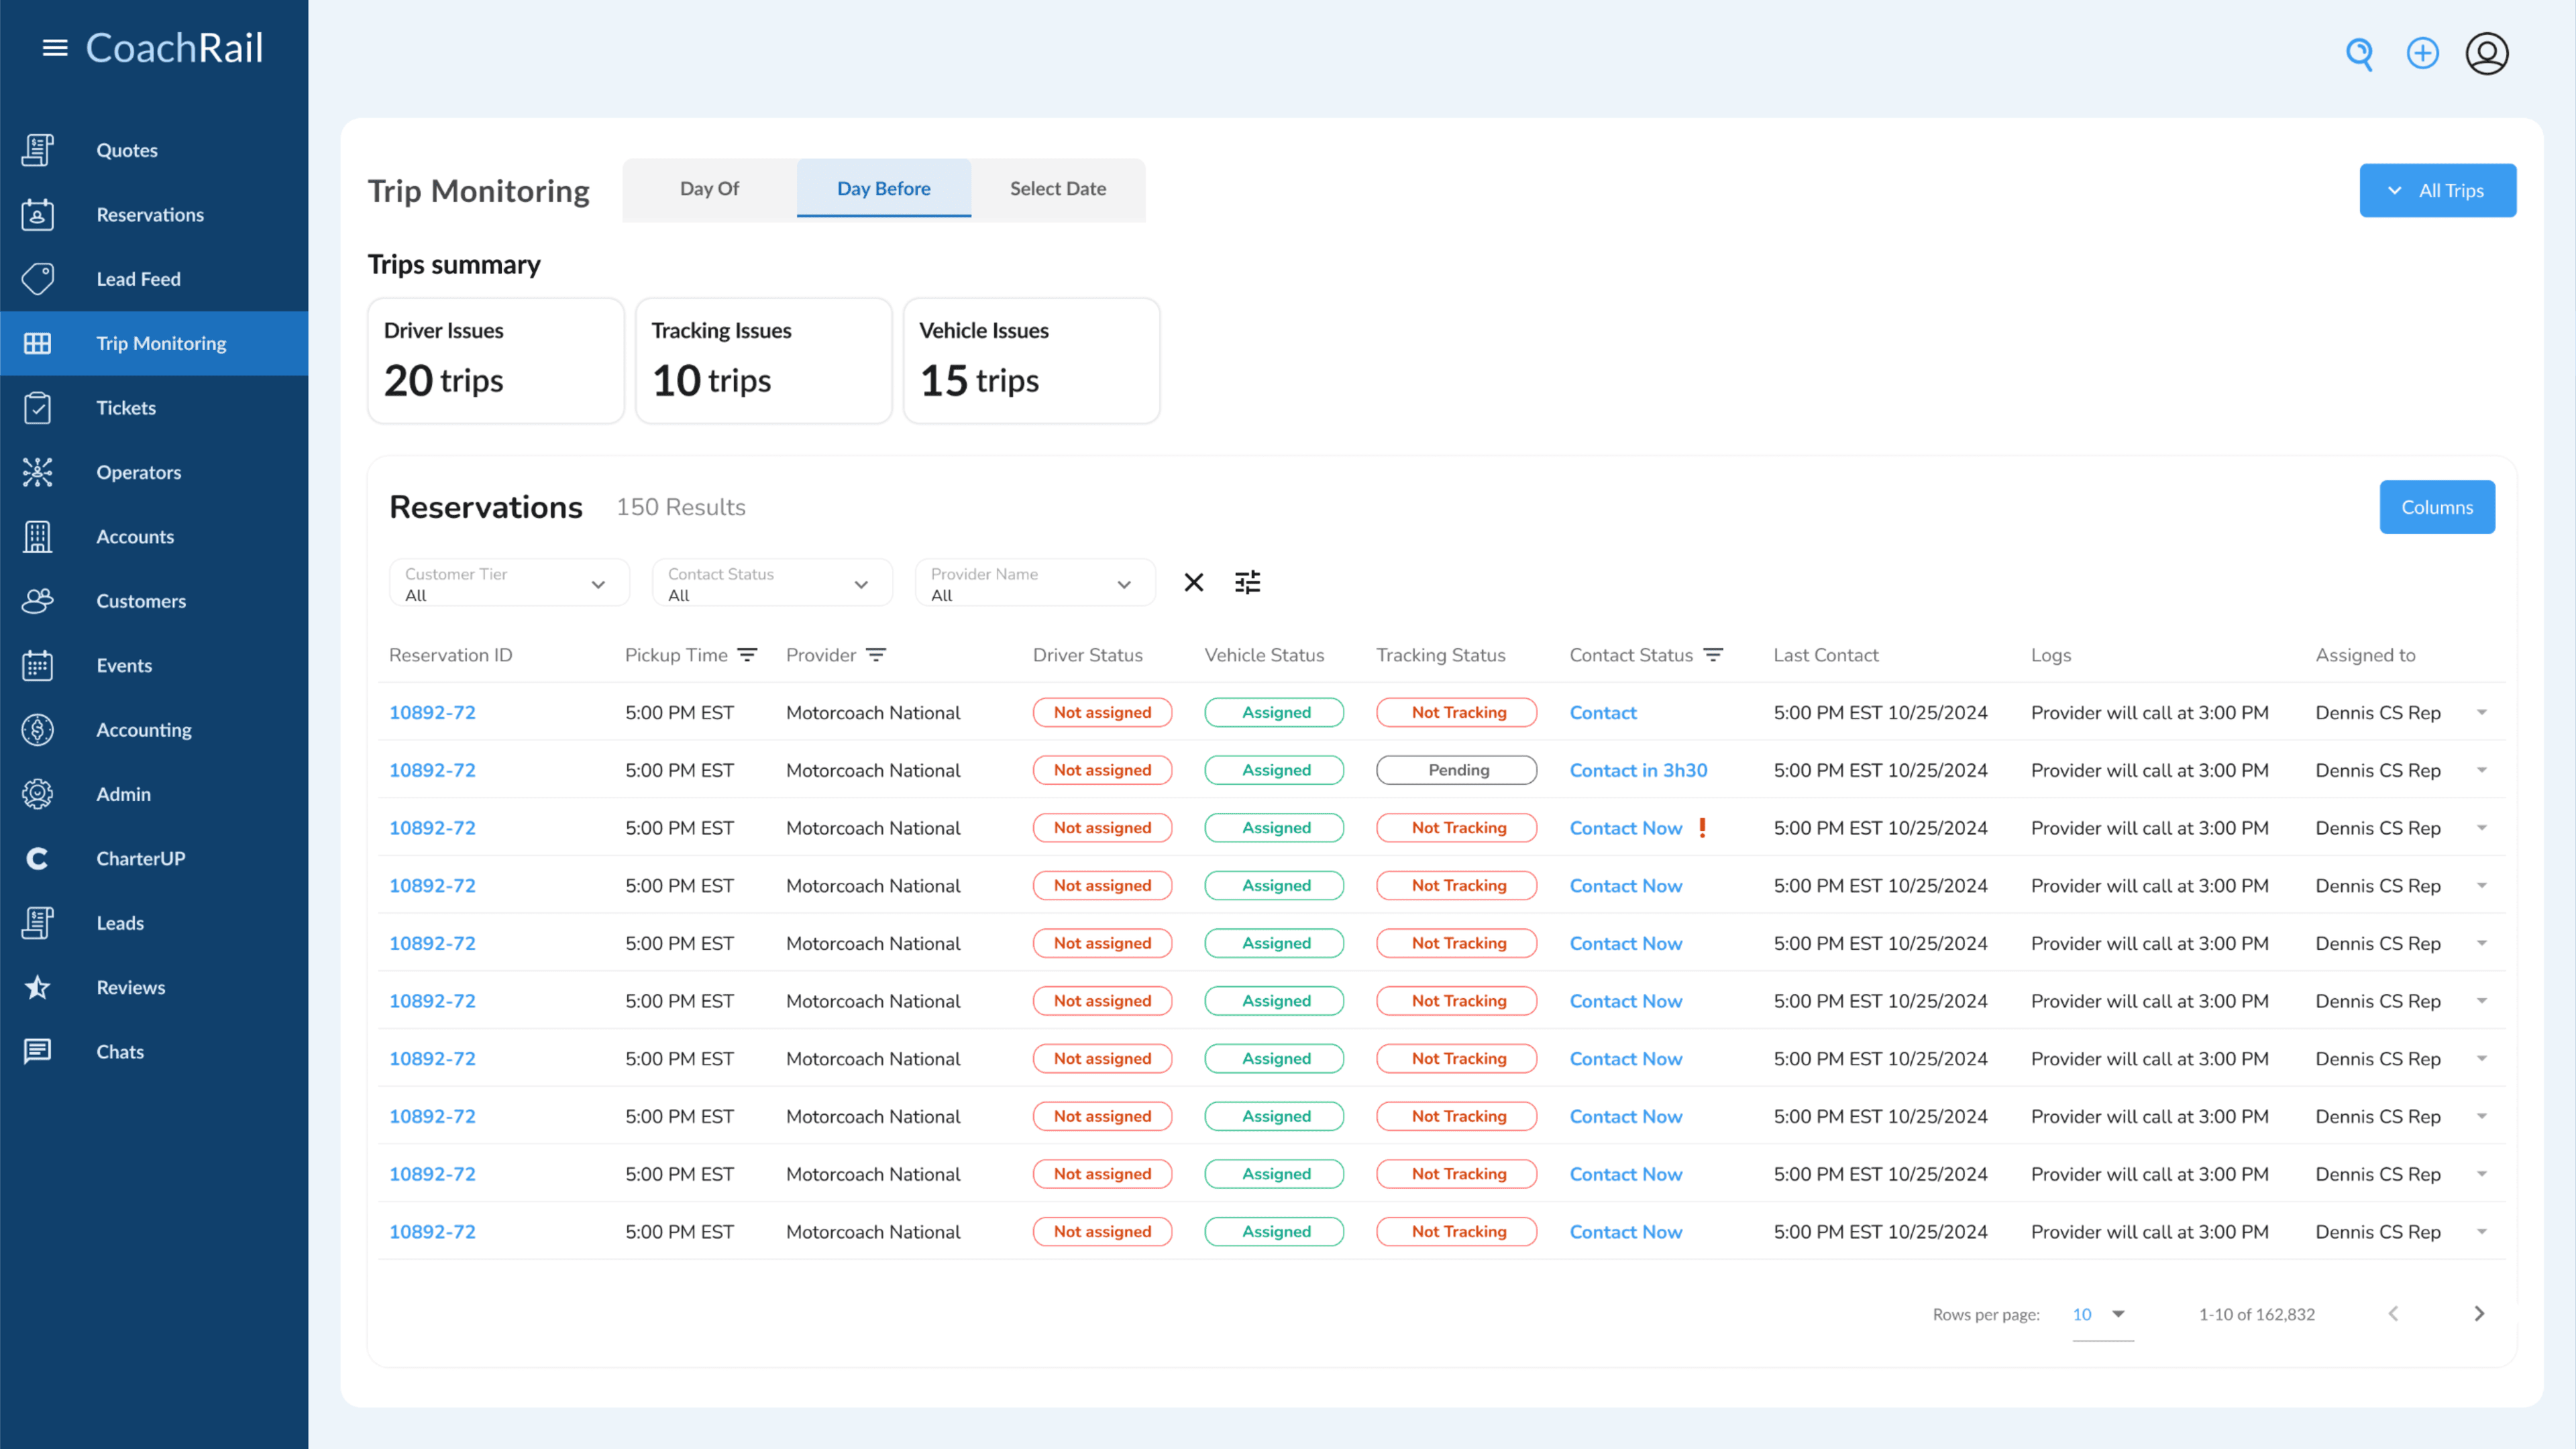
Teams usually set up war room-like operations for monitoring: a chaotic but somehow functional setup where everyone is watching the same screens. Behind the scenes, everything gets tracked via a really big and old spreadsheet that has seen no version control or audit trail and is 100% not a source of truth, since many teams change it over time without coordination. It's always a stressful situation with no reliable ground truth to fall back on.

Who solves visualization well?

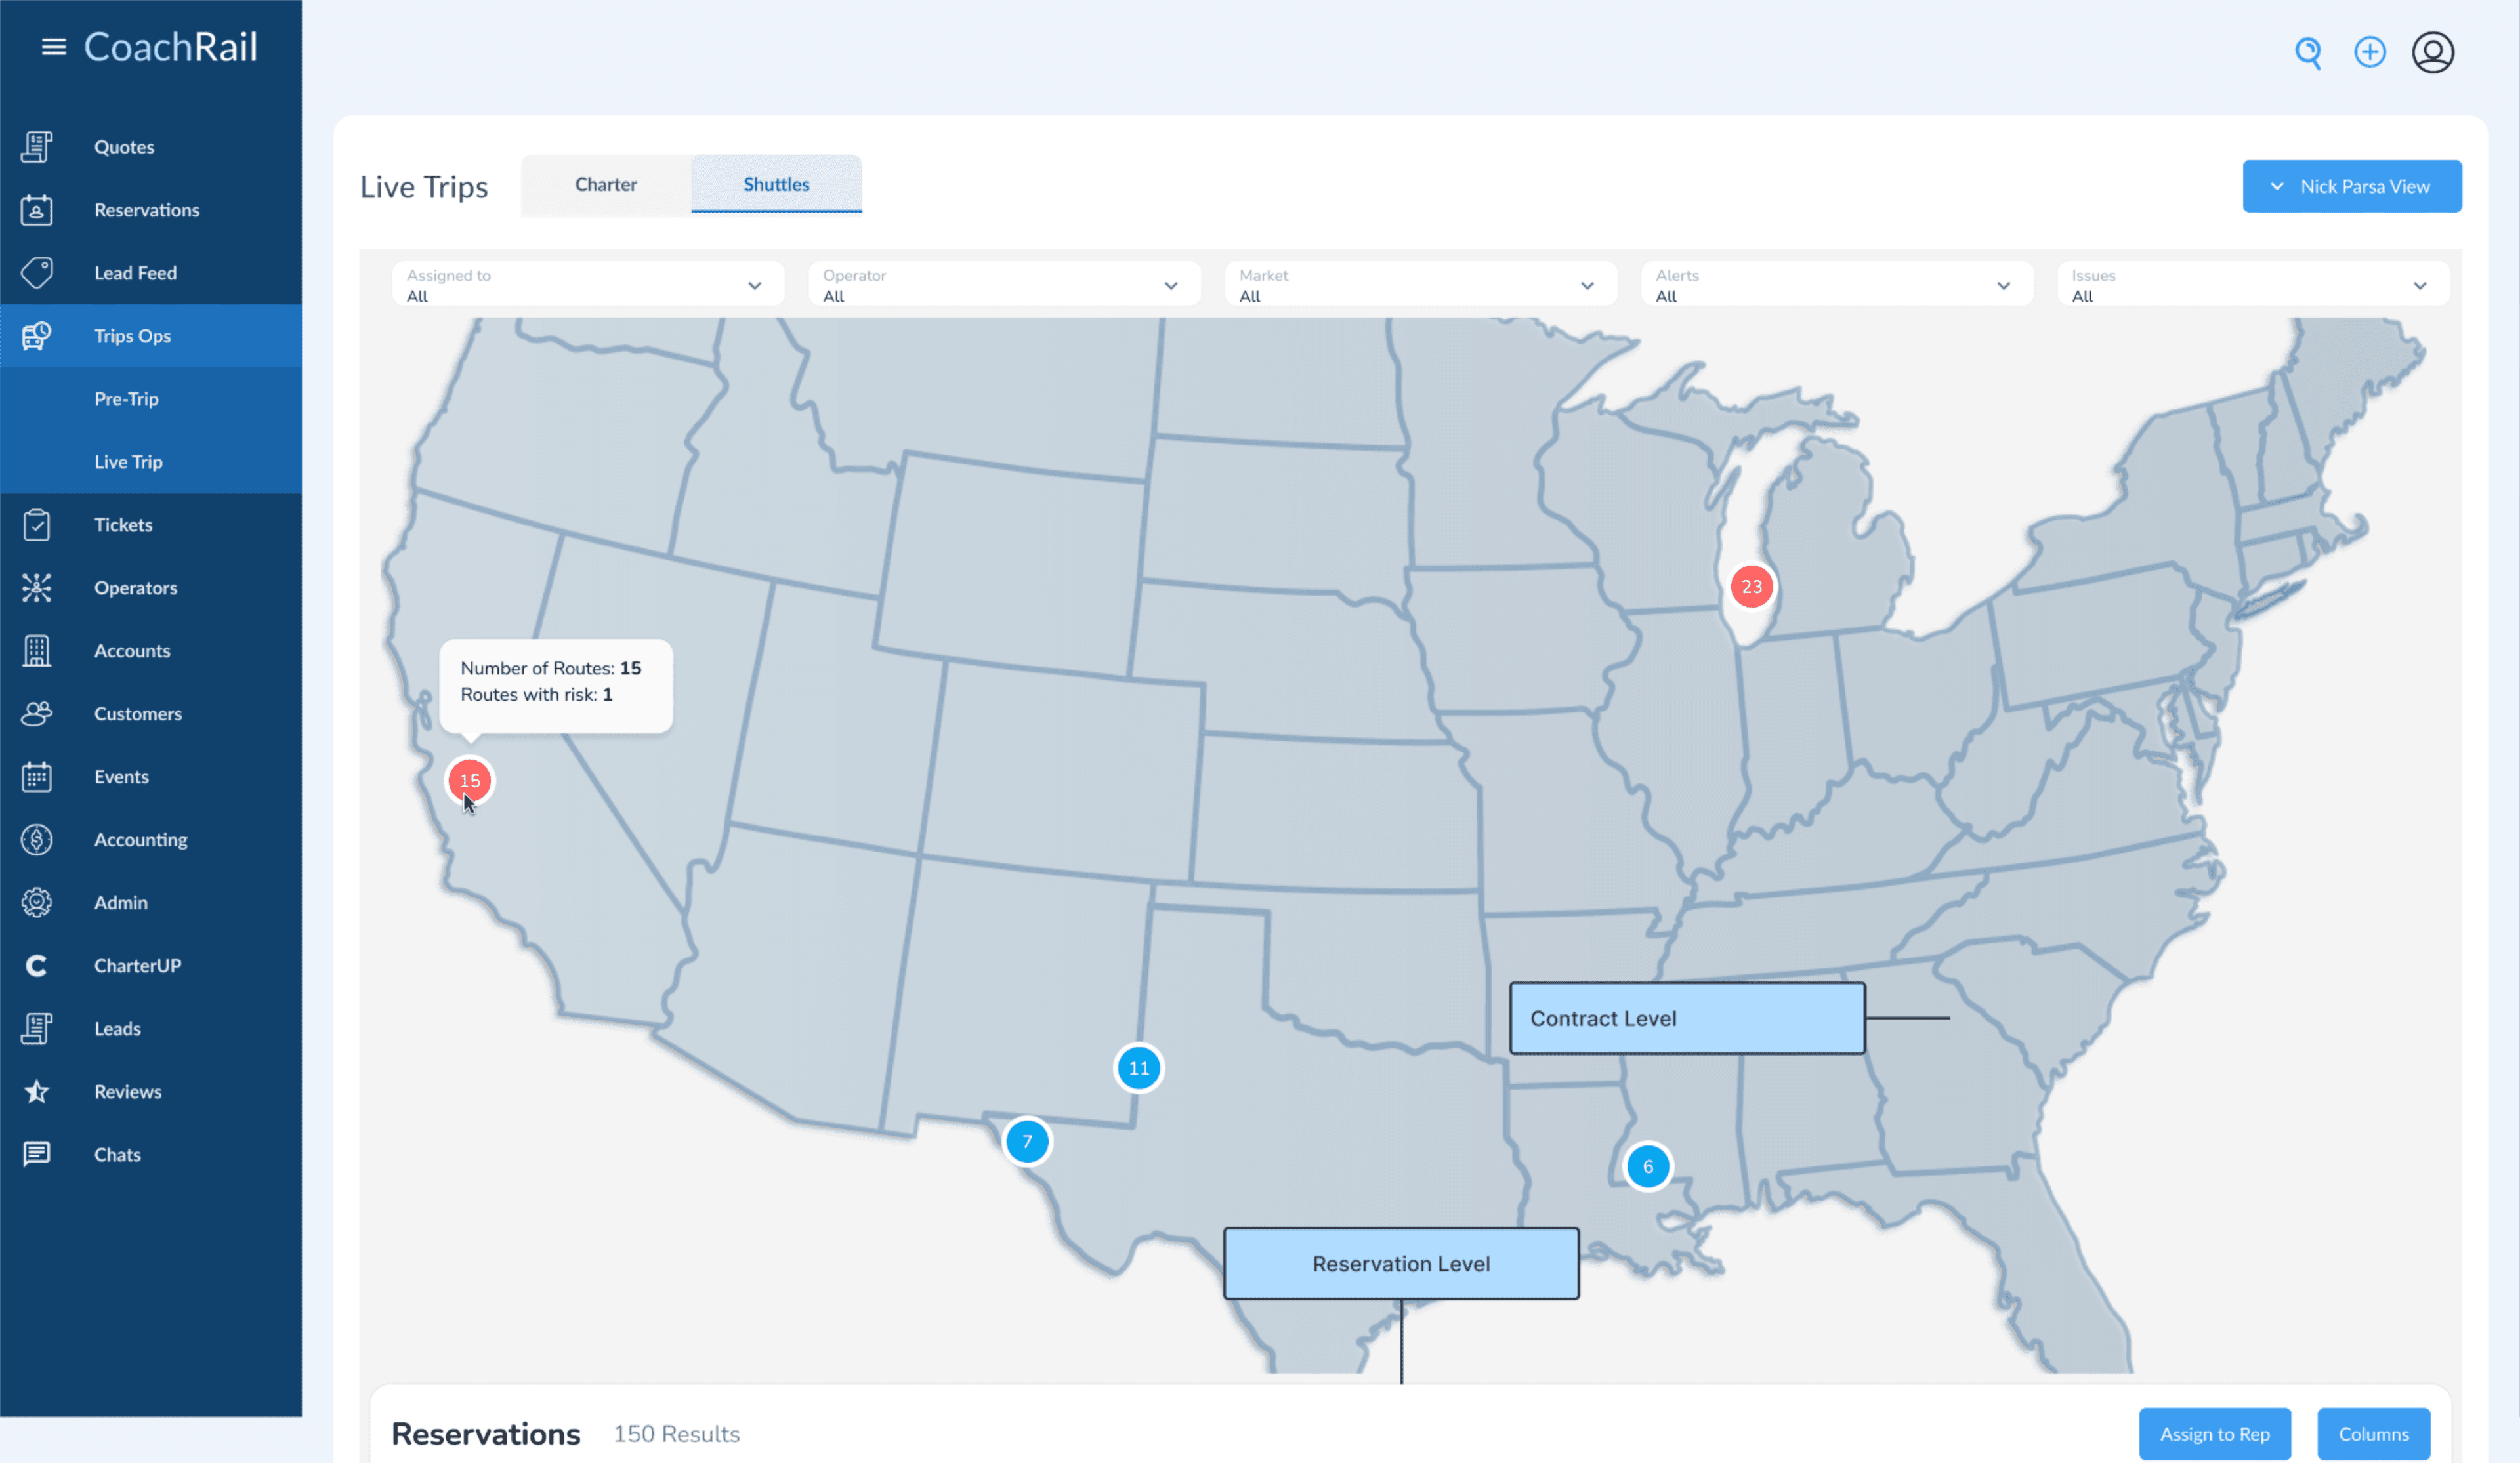
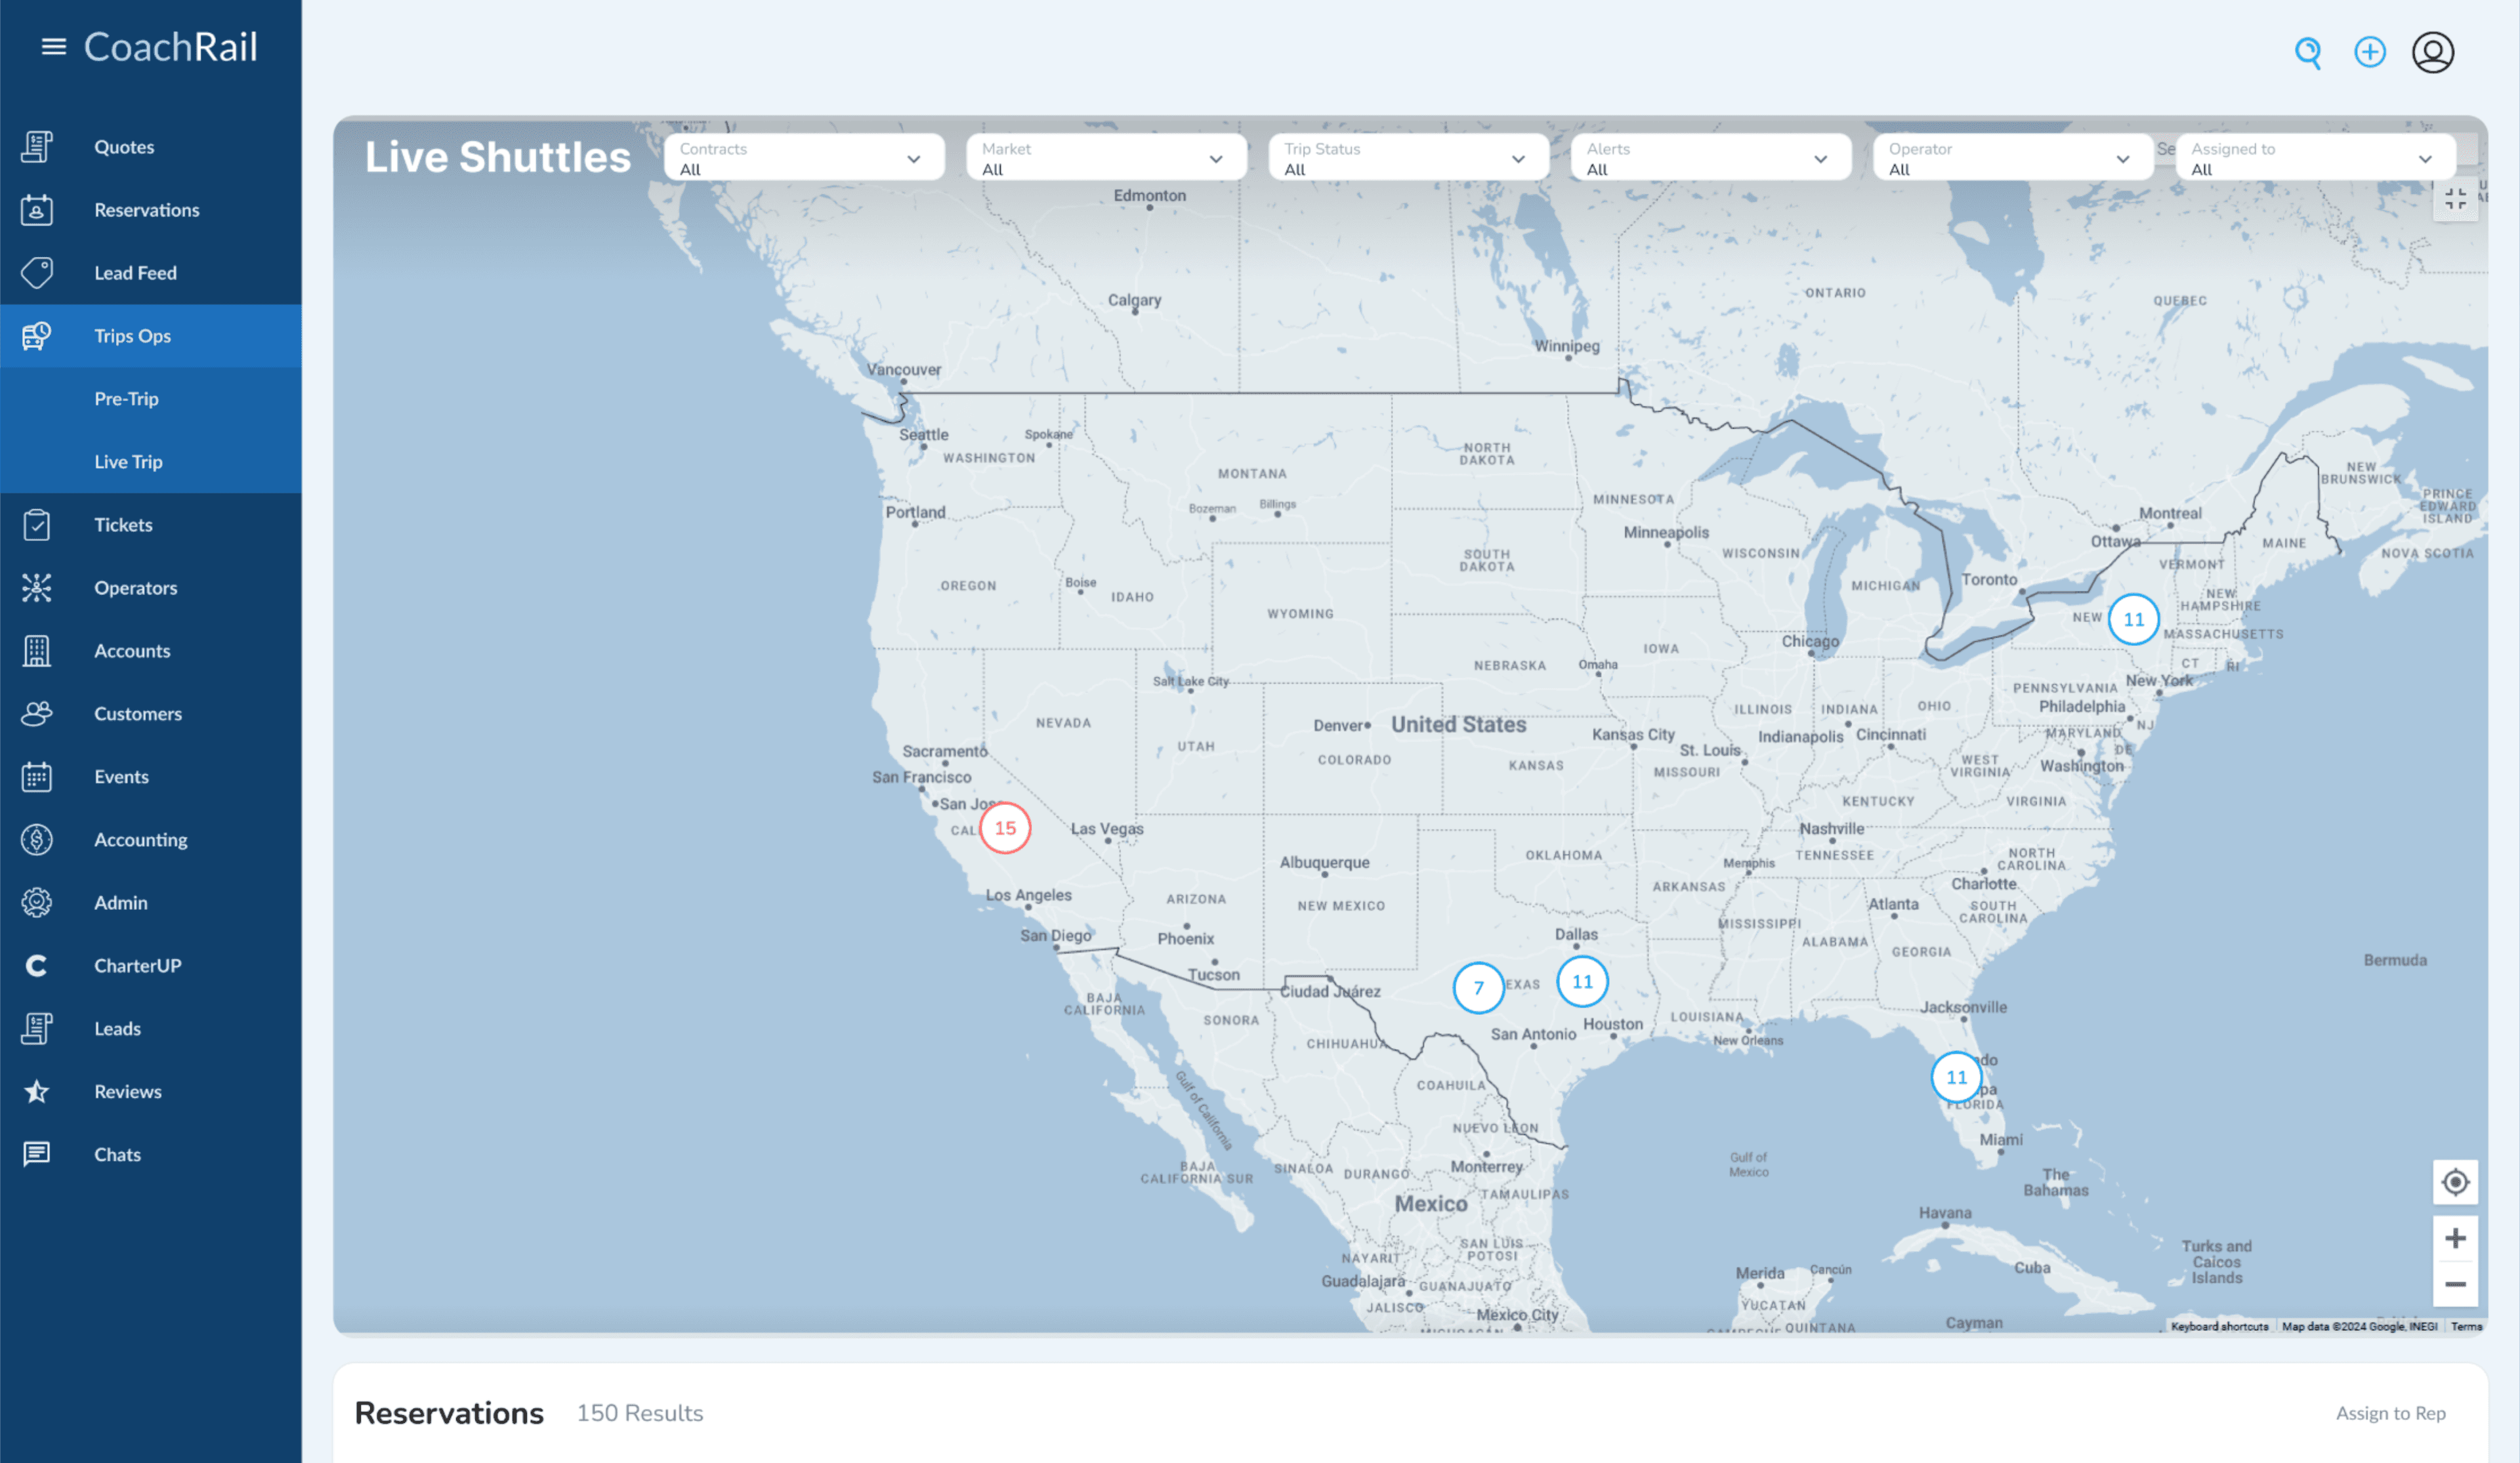
The obvious answer would be Uber or any live transport monitoring tool, but they don't scale well for this use case. You're usually tracking one trip at a time, not dozens spread across the US simultaneously. After thinking for a while, Flightradar24 emerged as the best analogy: a crowded space packed with information that can be filtered and focused on when needed, giving a whole team the ability to zoom in on what matters without losing the broader picture.

Flightradar24 reference

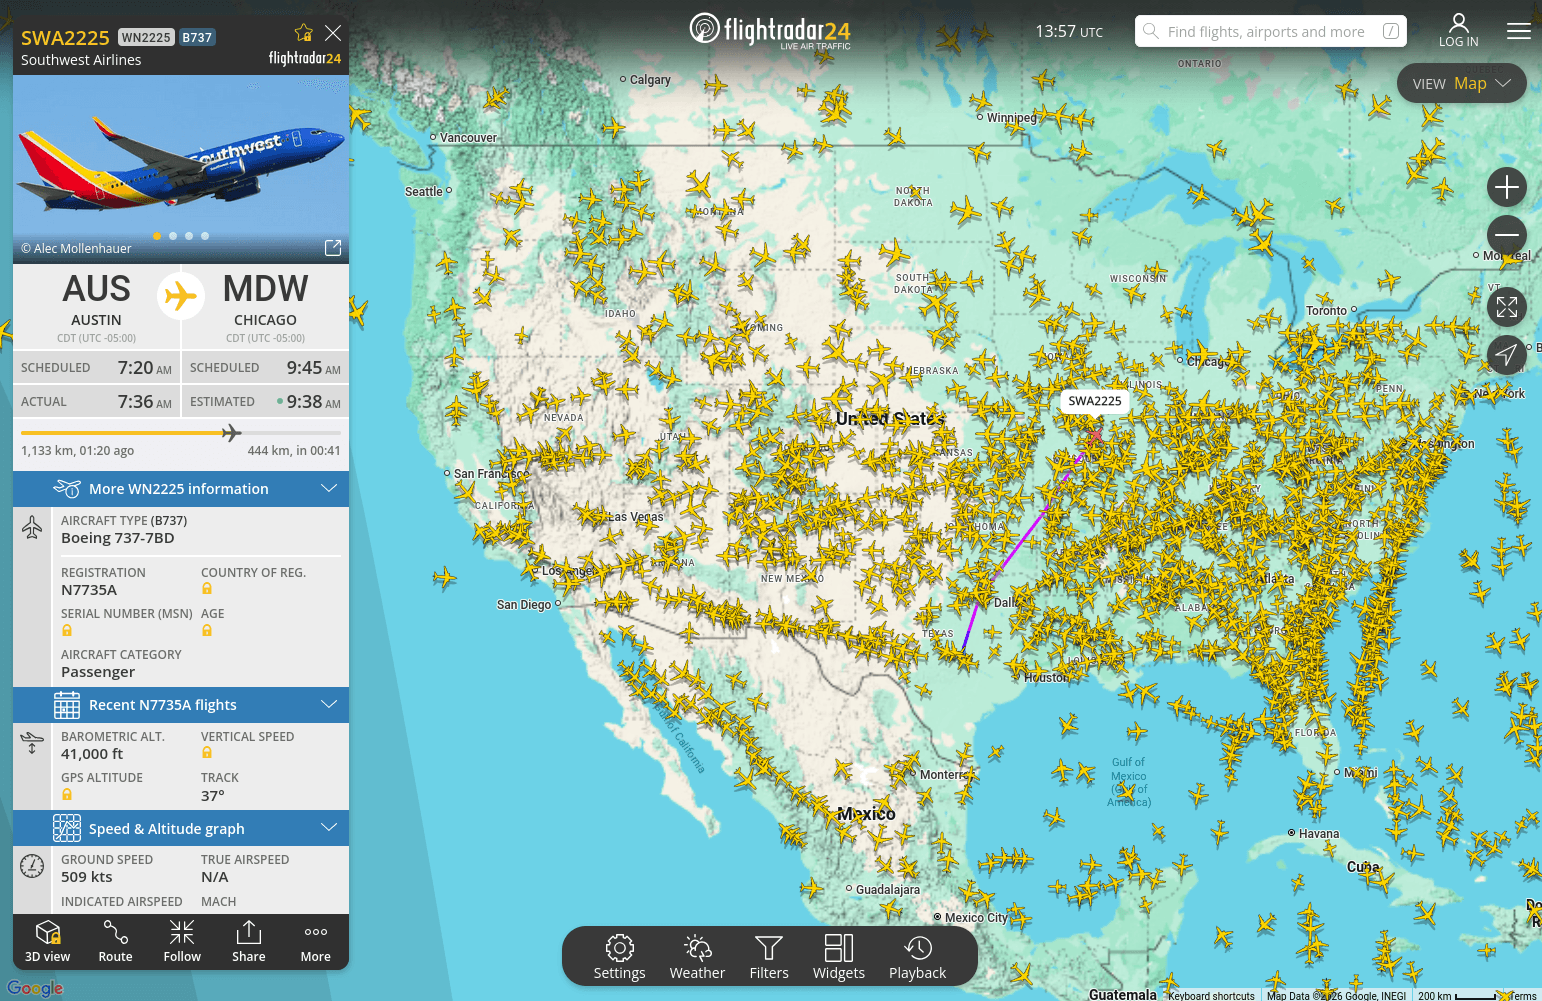
Flightradar24 — if we can track planes, why can't we track buses?

Research and first iterations

Research

Placeholder — describe what research was or wasn't possible at this stage, and the conditions under which the team had to work.

research type

User interviewsShadowing

time spent

~2 weeks

Objective

Placeholder — explain the reason behind this particular research type, or why a different approach was taken. Sometimes there was no time or space to do formal research.

Results

  • Placeholder finding — what was discovered overall.

  • Placeholder finding — a recurring behavior or pain point.

  • Placeholder finding — a workaround customers were using.

  • Placeholder finding — something that informed the direction.

First iterations

What was explored

Placeholder — describe the early explorations: sketches, whiteboard sessions, wireframes, or any first-pass ideas that were put to paper or screen.

Result

Placeholder — what came out of this iteration. What worked, what didn't, and what shaped the next step.

Feedback

Placeholder — any feedback received from users or stakeholders at this stage, even informal or directional.

sketches / wireframes

Challenges and steering the ship

Placeholder — name the situation or problem being dealt with in this case.

Challenge 01

The problem

Placeholder — describe the specific challenge, what triggered it, and any feedback that confirmed it was a real blocker.

“Placeholder — a quote or piece of feedback that illustrates the problem.”

The solution

Placeholder — describe what was done to address this challenge. Be honest about whether it fully solved the problem or was a best-effort given the constraints.

solution screenshot or evolution carousel

Challenge 02

The problem

Placeholder — second challenge description and its context.

The solution

Placeholder — how this one was addressed.

solution screenshot or evolution carousel

Results

final screens, collage or video

Final thoughts

Placeholder — overall reflection on the delivery. What the feature became, what it enabled, and any honest assessment of what could have been done differently.

What I've learned

  • Placeholder — a key takeaway from this project.

  • Placeholder — something about process, collaboration, or constraints.

  • Placeholder — something that would be done differently next time.